With the Categories tab selected, click on the Text link.

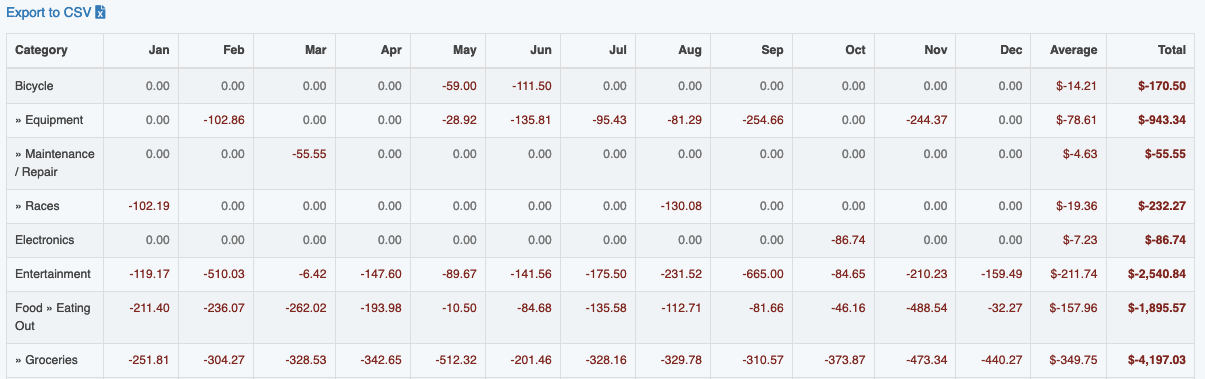
This report shows you all of your spending for the calendar year broken down by category and month.
Clicking on any cell in the table will take you to a search results page that shows you which transactions are included to come up with that sum.
You can sort any of the columns by clicking on the column header. By default, the chart is sorted by category name.
The options form changes depending on your premium status. If you are a free member, the report defaults to the current year. If the date is prior to April 15th then you can also see the previous year data.

ClearCheckbook Premium members have a much larger set of options they can access. These options are shown in the screenshot and explained in the table below.

| Option | Description |
|---|---|
Date Range |
You can set the start and end dates to show up in the chart. |
Calculate Totals Using |
There are three options: All Months - this is the default option and will show all months between the two dates. Non-empty Months - any months do not have any data will be hidden. Months So Far - if the end date in the date range is in the future, only months through the current month will be shown. |
Account |
You can select an account, accounts or account group to narrow down what data is calculated. |
Deposits |
There are three options: Sum - this is the default option and sums deposits and withdrawals to show one value. Ignore - any deposits will be ignored and only the withdrawals will be shown. Separate - this will show two values in each cell where there are both deposits and withdrawals. |
Rollup Categories into Parents |
You can choose to have only the parent categories shown in the results. All sub category values will be summed into the parent total. |
Sum into Parents |
By default, only transactions directly categorized as the parent will show values in the parent row. By changing this to Yes, the total of all sub category spending for that parent will also show up in the parent row. |
Hide categories with no value |
If you have categories that don't have a 0 value across the chart and don't want them displayed, you can change this to Yes. When changed to Yes, only categories with values will appear in the chart. |
Average Column |
You can choose to Show or Hide the Average column. |
Export to CSV link directly above the chart.